Rightly Skewed
In the realm of statistics and data analysis, distributions play a pivotal role in depicting the patterns and behaviors of various phenomena. Among these distributions, the concept of skewness adds another layer of complexity, offering insights into the asymmetry of data. Rightly skewed distributions, in particular, present a fascinating landscape where understanding the nuances is crucial for accurate interpretation and informed decision-making. In this exploration, we delve into the intricacies of rightly skewed distributions, deciphering their significance, characteristics, and real-world implications.
Understanding Skewness:
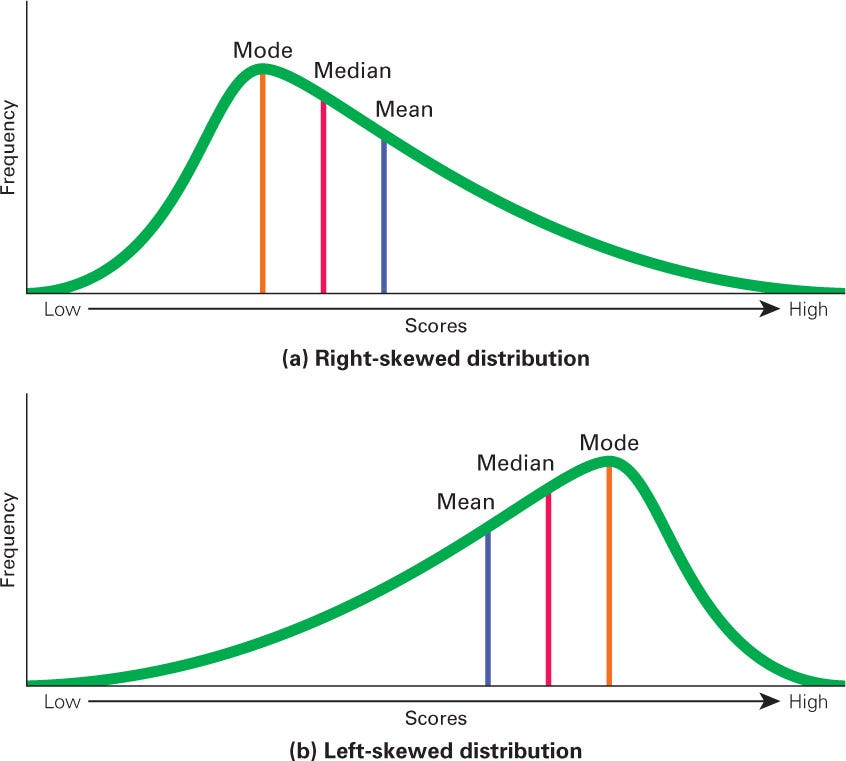
Before delving into rightly skewed distributions, it’s imperative to grasp the fundamental concept of skewness. Skewness refers to the lack of symmetry in a distribution. A perfectly symmetrical distribution exhibits equal tendencies on both sides of the central tendency, typically the mean, median, and mode coincide. However, in skewed distributions, this equilibrium is disrupted, manifesting in a tilt towards one direction.
Characteristics of Rightly Skewed Distributions:
Rightly skewed distributions, also known as positively skewed distributions, are characterized by a longer tail extending towards the right side of the distribution. This elongation indicates that the majority of observations cluster towards the lower end of the distribution, while a few extreme values pull the mean towards the higher end. Visually, this results in a distribution where the mean is greater than the median, as the tail of the distribution stretches towards higher values.
Real-world Examples and Applications:
Rightly skewed distributions manifest in various real-world scenarios, offering valuable insights across different domains:
- Income Distribution: Income distribution often follows a rightly skewed pattern, with the majority of individuals earning moderate incomes while a small fraction enjoys significantly higher earnings. This phenomenon is evident in societies worldwide, where a few affluent individuals or groups influence the overall distribution.
- Test Scores: In educational assessments, test scores frequently exhibit a rightly skewed distribution. Most students tend to score around the average mark, while a smaller proportion achieves exceptionally high scores, contributing to the skewness towards the right end of the distribution.
- Stock Market Returns: The distribution of stock market returns often demonstrates a positive skew, with the majority of trades yielding modest gains or losses, while occasional outliers result in significant profits for a few investors.
Implications and Interpretations:
Understanding the dynamics of rightly skewed distributions is paramount for accurate interpretation and decision-making:
- Central Tendency: In rightly skewed distributions, the mean tends to be greater than the median and mode, indicating that extreme values pull the average towards higher values. When analyzing such distributions, it’s essential to consider whether the mean accurately represents the typical value, or if it’s skewed by outliers.
- Risk Assessment: In financial contexts, rightly skewed distributions imply the presence of tail risks, where extreme events have a disproportionate impact on the overall distribution. Risk management strategies should account for these tail risks to mitigate potential losses.
- Sampling Bias: When dealing with rightly skewed data, sampling bias can significantly influence results. Failing to account for the skewed nature of the distribution may lead to inaccurate conclusions, particularly in scenarios where outliers exert substantial influence.
Mitigating Skewness:
While skewness is inherent in certain datasets, there are strategies to mitigate its impact:
- Data Transformation: Transforming skewed data through techniques such as logarithmic or square root transformations can help normalize the distribution, making it more suitable for statistical analysis.
- Robust Measures: Instead of relying solely on the mean, utilizing robust measures such as the median or trimmed mean can provide a more accurate representation of central tendency in the presence of outliers.
- Outlier Identification: Identifying and treating outliers effectively is essential for mitigating the skewness induced by extreme values. Techniques such as box plots or z-score analysis can aid in identifying outliers for further examination.
Conclusion:
Rightly skewed distributions offer a unique lens through which we perceive the asymmetry inherent in various datasets. Understanding their characteristics, implications, and mitigation strategies is indispensable for researchers, analysts, and decision-makers across diverse fields. By unraveling the enigma of rightly skewed distributions, we equip ourselves with the tools to navigate the complexities of real-world data with clarity and precision.